
.png)

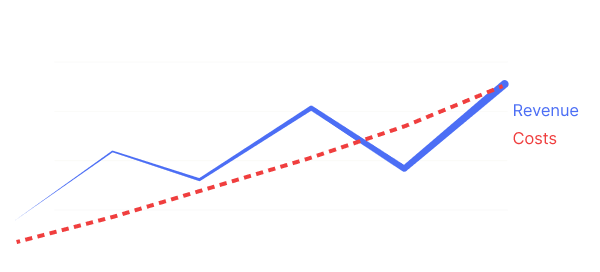
Revenue has sat in the same band for years while costs keep climbing. You have changed sales managers more than once. The pattern returns every time.
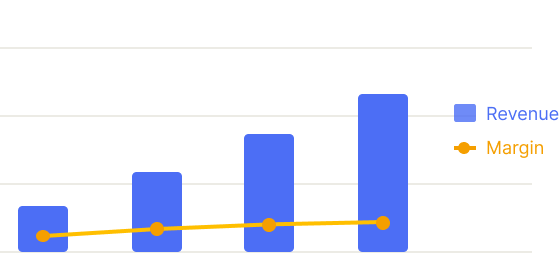
The top line grows while margin stays where it was. More volume arrives without more profit, and no report on your desk explains where it went.
%201.png)
You have just taken on commercial leadership and need the real state of the revenue base fast. You want evidence you can act on, rather than another round of opinions from the people who built the problem.
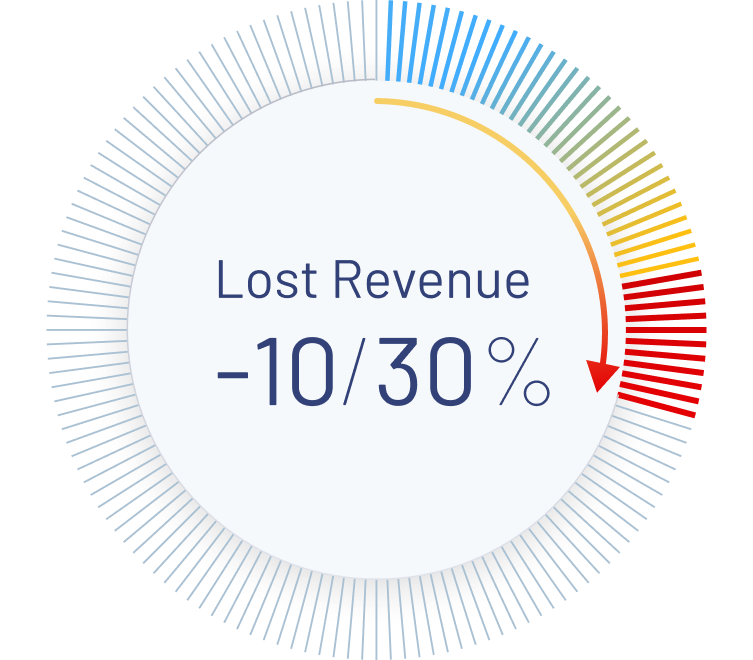
No alarm goes off. No report shows it. It rarely shows up on a P&L. It hides in deals that look profitable but drain resources, in segments that drive volume but erode margin, and in pricing that has not been revisited in years.

Then the loss-making tail eats it back down to the number you report. The monthly pack averages your strongest customers and your weakest together, so the subsidy stays invisible. Revenue is up, the margin looks acceptable, the auditor signs, and the most expensive customers in the business hide inside the one document everyone trusts to reveal them.
The single largest piece, the loss-making customers your best ones are funding, is also the one no standard report can show you.
The monthly review presentation reports averages, and averages merge businesses that behave nothing alike. Your strongest customers fund your weakest without anyone ever deciding that they should.
Some accounts look like wins on the revenue line. In practice they consume the most capacity, raise the most service problems, and pull focus away from the business actually worth having.
Business reviews settle on aggregate revenue and margin, so they justify the past instead of pointing to the next move. Leadership cannot see where the real leverage sits because the reporting was never built to show it.
No clear commercial requisites, no explicit exclusions. Capacity flows toward volume instead of value, and the team competes on price instead of differentiation. A full point of price disappears through quiet, late-stage concessions that never reach a review.

We rank every customer, product, selling partner, and geography by revenue, volume and margin and plot the running total. That first whale curve usually surprises the room twice over, and it shows where you win at the strongest margins with the least friction.

We turn the patterns into a prioritized action plan, an account scorecard, and the commercial requisites and exclusions your team will run from. The findings also set the focus and pricing baselines that your Sales Operating System (Sprint 12) protects over time.

Your team owns the output. We walk leadership through the findings and equip your sales manager with the evidence to lead differently, starting with the very next quarter.
.webp)
Your full revenue base decomposed by customer, product-market combination, margin quality, and growth trajectory. Accelerators and drains identified and ranked.
Every key account scored on strategic fit, margin contribution, cost-to-serve, and growth potential, then sorted into pursue, maintain, and exit tiers.
Documented criteria for the business your team should pursue and the business it should deliberately leave alone. The same definition, in every rep's hands.
The sequenced moves that come next, naming the segments to double down on, the deals to renegotiate, the accounts to phase out, and the fastest path to margin recovery.
The 2-minute diagnostic maps your company against all twelve sprints and shows where Revenue Intelligence fits in your priorities.
.avif)
Industrial B2B — €100M+ revenue, 6 consecutive years of double-digit growth.
A mid-market industrial company had been growing at approximately 13% a year for six consecutive years. When we examined the data beneath the headlines, three problems appeared. Margin had barely developed, productivity was flat, and profit as a percentage of revenue stayed too low for a company of that scale.
The Revenue Intelligence Sprint decomposed the consolidated figures into segment-level patterns, and showed which product market combinations were generating real margin and which were consuming capacity without proportional return.
Margin improvement within 12 months of restructuring account priorities.
of companies say they are not doing a good job executing their go-to-market strategy, despite 85% calling it strategically important. The gap between intent and execution is where revenue intelligence makes the difference.
of organizations catch a failing initiative in time to change course, and just 22% catch a winner in time to back it harder. Most see it only at the year-end review, if at all, by which point the spend is long committed. Revenue Intelligence puts the signal in front of you while there is still quarter left to act.
Once you know which segments drive the most value, Buyer Precision builds a data-backed Ideal Customer Profile so your team knows exactly who to pursue.

With your revenue patterns and ideal buyer defined, this sprint builds the value propositions that speak directly to the decision criteria of your best-fit customers.
The next step is a 30-minute conversation where we assess whether the Revenue Intelligence Sprint is the right starting point for your business.


.svg)